Runs the app in the development mode.
Open http://localhost:3000 to view it in your browser.
The page will reload when you make changes.
You may also see any lint errors in the console.
npm test
Launches the test runner in the interactive watch mode.
See the section about running tests for more information.
npm run build
Builds the app for production to the build folder.
It correctly bundles React in production mode and optimizes the build for the best performance.
The build is minified and the filenames include the hashes.
Your app is ready to be deployed!
See the section about deployment for more information.
npm run eject
Note: this is a one-way operation. Once you eject, you can’t go back!
If you aren’t satisfied with the build tool and configuration choices, you can eject at any time. This command will remove the single build dependency from your project.
Instead, it will copy all the configuration files and the transitive dependencies (webpack, Babel, ESLint, etc) right into your project so you have full control over them. All of the commands except eject will still work, but they will point to the copied scripts so you can tweak them. At this point you’re on your own.
You don’t have to ever use eject. The curated feature set is suitable for small and middle deployments, and you shouldn’t feel obligated to use this feature. However we understand that this tool wouldn’t be useful if you couldn’t customize it when you are ready for it.
Kitodo.Presentation is a feature-rich framework for building a METS- or IIIF-based digital library. It is part of the Kitodo Digital Library Suite.
Kitodo.Presentation is highly customizable via a user-friendly backend and flexible design templates. Since it is based on the great free and open source Content Management System TYPO3, it integrates perfectly with your website and can easily be managed by editors. Kitodo.Presentation provides a comprehensive toolset covering all requirements for presenting digitized media. It implements international standards such as IIIF Image API, IIIF Presentation API, OAI Protocol for Metadata Harvesting, METS, MODS, TEI, ALTO, and can be configured to support any other descriptive XML format using simple XPath expressions. With Kitodo.Presentation you can publish digitized books, manuscripts, periodicals, newspapers, archival materials, 3D objects, audio and video.
For a complete overview of all features, visit the Kitodo homepage.
Kitodo was formerly known as Goobi. Older releases can be found on Launchpad.
Kitodo is an open source software suite intended to support the digitisation of cultural assets for libraries, archives, museums, and documentation centres of all sizes. A range of modules with open interfaces support the production, presentation, and archiving of digital assets. The software can be flexibly used for a multitude of digitisation strategies and scalable business models – for in-house projects, purely corporate services, or hybrid endeavours. Kitodo is backed and continually updated by a dynamic user and developer community and the non-profit association Kitodo e. V.
Information | Communication | Support
For general information and news, please visit our website.
As a system that has to meet the diverse requirements of a wide variety of institutions and the materials they want to digitise, Kitodo is a rather complex software solution, the installation and configuration of which can be challenging, especially for users with limited IT capacities and know-how.
To ensure it can best advise and assist users on technical and organisational issues, the Kitodo community has established support structures for the following typical scenarios.
Users who have clearly defined questions relating to the use and development of Kitodo or Kitodo modules are well-served by the Kitodo mailing list. They will typically receive helpful answers from the community or the Kitodo release managers within a short period of time. If this should be unsuccessful for any reason, the Kitodo association office will address your matter to an experienced member institution. You do not need to be a member of the association to use the mailing list.
For users who occasionally need more extensive advice and possibly also on-site practical assistance for Kitodo installation, workflow modelling, etc., the Kitodo office maintains a list of voluntary mentors. Requests can be directed to these proven experts from various libraries by the association office. More information is available from the association office.
For institutions that would like an initial and extensive introduction to Kitodo in the form of a product presentation or ongoing support, in particular on-site, we are happy to provide a list of companies that to the best of our knowledge have already worked in these fields. To obtain the company list, please also use the association office address. Please bear in mind that the association cannot provide further assistance in selecting service providers.
Collection of open-source tools for web performance testing and optimization.
This list appeared as a logical continuation of load-testing-toolkit collection but for web performance and real user experience monitoring.
Tools
In alphabetical order.
autowebperf – A flexible and scalable framework for running web performance audits with arbitrary audit tools including PageSpeed Insights, WebPageTest and more.
boomerang – A JavaScript library that measures the page load time experienced by real users.
browser-perf – A Node.js based tool for measuring browser performance metrics.
browsertime – A harness to automate running JavaScript in your browser primary used to collect performance metrics.
garie – An out-the-box web performance toolkit that provides pre-configured dashboards, tooling and historic reporting to understand applications web performance.
lighthouse – An automated tool analyzes web apps and web pages, collecting modern performance metrics and insights on developer best practices.
puppeteer-webperf – Automating web performance testing with puppeteer, a Node.js library which provides a high-level API to control headless Chrome or Chromium over the DevTools Protocol.
pwmetrics – Progressive Web Metrics, a CLI tool and library to gather performance metrics via lighthouse.
sitespeed.io – A complete web performance tool to measure the performance of website.
speedlify – Benchmark the web performance and accessibility of sites over time.
speedracer – Collect performance metrics for your library/application.
speedscope – A fast, interactive web-based viewer for performance profiles.
webpagetest – A performance measurement tool to test website speed from around the globe using real browsers at consumer connection speeds with detailed optimization recommendations.
web-tracing-framework – Google’s tools for instrumenting, analyzing, and visualizing web apps.
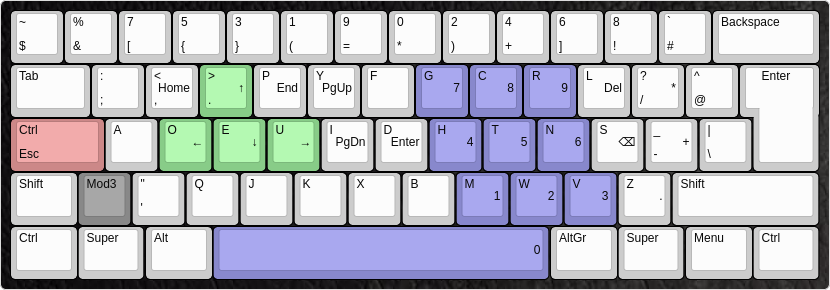
Note, that the location of the console keymaps differs between distributions.
On Gentoo:
cp mwb.map /usr/share/keymaps/i386/dvorak/
On Arch/Parabola:
cp mwb.map /usr/share/kbd/keymaps/i386/dvorak/
To load the keymap temporarily in your tty:
loadkeys mwb
Permanently set using systemd-localed:
localectl set-keymap mwb
On other init systems it differs aswell.
On OpenRC you can edit the file /etc/conf.d/keymaps and set
keymap="mwb"
Change the behaviour of CapsLock
The layout does not change the behaviour of the Capslock key. However, it is advised that the user does that, since this key is, compared to Esc and Ctrl, easy to access but usually not used as often.
One recommendation is to use xcape so CapsLock can be used as Esc and Ctrl simultaneously:
“Should I remap my VIM keybindings when using Dvorak?”
Recommendation: No.
Vim keybindings are mostly chosen in a way that they are intuitive to remember (e.g. ‘cw’ for ‘change word’), so it’s sensible to remember the meaning of the actual letters, not just the keybindings. Muscle memory usually adapts quickly.
As for the most important part, the hjkl-style navigation: Try it out. It still works perfectly fine on dvorak. j-k are comfortably reachable with the left index, and h-l is no problem either with the right hand. Horizontal and vertical movement are split between the two hands, which is an added bonus.
Remember that this keyboard layout offers comfortably reachable arrow-keys too, although hjkl is still preferable in vim since a mod key isn’t needed.
“How do I switch from, say QWERTY? How long does it take get to get back to the same speed?”
The best way to switch to a new layout is to be consistent. Choose a date, and from there on, force yourself to exclusively use the new layout, no matter what you’re doing. Everytime you go back to the old layout, even if it’s just to quickly write an important e-mail, you tend to make a big step backwards. Avoid using the old layout until you’re able to type in the new layout without concentrating, and without accidental flashbacks to the old layout. To get to that point takes – from personal experience – at least 1-2 weeks, so maybe don’t decide to switch layouts right before you write a master thesis.
Getting back to the old speed however can take months.
Note however that the purpose of this layout is not to improve typing speed, but to type more efficiently and put less strain on your fingers.
Furthermore, make sure you use the right fingers for the according keys right from the start, and learn proper touch typing, which means typing without looking down at the keys. Using a keyboard labelled with QWERTY or any other layout can actually be helpful, because it encourages touch tying. Don’t even think about labelling the keys or rearranging the keycaps, it will only make it harder in the long run.
“Will I still be able to use my old layout after switching?”
Yes. It might take a minute to get used to it again, and you will most likely type at a decreased speed, but it’s certainly possible to type in the old layout.
As noted in the question above though, make sure you’re already proficient before you go back to the old layout, in order not to hold back your progress.
This is a very simple implementation of papago proxy server, using headless Chrome.
Why?
Sometimes you just want to test with Papago API without signing up for Naver Developers API… This is just for that. This means that you do not need a secret key.
(the free plan on Vercel is slow, might need to wait for about 6~7 secs)
Specs
GET /translate?text={text}&wait_for_msec={msec}
querystrings:
text: required. text to be translated
wait_for_msec: optional. custom option to wait on headless Chrome until translate is fully done. This can be set if the text is too long to be translated in a short time. This is to be removed later.
GET https://papago-proxy.vercel.app/api/translate?text=hello
Response:
{
  "text": "안녕하십니까"
}
Known limitations
The free plan on vercel serverless functions only supports running up to 10 secs. It won’t allow long sentences to be succesfully translated. The free plan runs quite slowly too, due to memory limitations.
As far as I know, this must not be used for commercial purposes. Sign up for Naver developers API and use that if you want some commercial purpose.
Cluster
src/server/server.ts is for using cluster on non-serverless environments. I doubt if it is worth using it.
Todos
More language options
Deploy to AWS lambda or Azure for a better example
This repository contains a blinky-button project for the STM32 Nucleo-144 development board targeting the STM32F767ZI microcontroller. The project uses:
GNU Make (Build System)
GNU ARM Embedded Toolchain (Compiler)
STM32CubeF7 MCU Firmware Package (BSP/Drivers)
ST-Link or OpenOCD (Debug)
Motivation
I often need to develop software for STM32 microcontrollers and want to use GNU Make as the build system. While STM bundles example projects and templates in the STM32Cube packages (such as STM32CubeF7), the projects do not support GNU Make and instead support IAR, Keil, and Eclipse (Atollic or AC6). These projects also don’t include debug configurations. While I enjoy using those tools for navigating code and debugging, I prefer to manage the build system with human readable files.
Existing Solutions
Other projects that address this problem:
damheinrich/cm-makefile: Makefiles for Cortex-M processors. Not STM32 specific, but should be easily configurable. Overall the level of configurability and complexity is not needed for a small project.
STM32-base/STM32-base: Essentially solves the exact problem I have, combining GNU Make with STM32 source code. I tried to use this project but ran into a lot of bugs and problems. At the time of writing I do not have bandwidth to contribute, but eventually should debug this more. It also has more configurability and complexity than needed, since it supports many STM32 devices.
User Guide
Setup
GNU Make – Usually installed by default on Linux and macOS, so no work to do here.
GNU ARM Embedded Toolchain – Download the toolchain and update the TOOLCHAIN_ROOT variable at the top of the Makefile. If you’ve added the bin/ directory of the toolchain to your system PATH then you can leave this variable blank.
STM32CubeF7 MCU Firmware Package – This is a submodule of this repository, so it can be downloaded by running git submodule init && git submodule update. However if you already have it installed on your system, skip the submodule commands and just update the VENDOR_ROOT variable in the Makefile to point to your copy.
ST-Link or OpenOCD – For debugging, you will need software that knows how to talk to your debug hardware over USB. On the Nucleo-144 board, there is an ST-Link debugger. You can talk to it using ST-Link tools or OpenOCD. On Linux I was able to build both of these packages from source easily following the instructions. On macOS both packages were downloadable in binary form using brew install stlink openocd.
Build and Debug
Simply run make to build the project.
In another terminal, start the GDB server by running make gdb-server_openocd.
To use ST-Link, run make gdb-server_stlink.
Run make gdb-client to download the code and start debugging.
Optionally, open a serial terminal to view the printf function calls.
For example, run pyserial: python -m serial - 115200 and then select the port labeled “STM32 STLink”.
Para rodar este projeto, sem intenção de ensinar padre a rezar missa, segue o comando.
dotnet run
A idéia é criar uma sequência que não pode ser alterada, devido a verificação do bloco anterior em conjunto com o bloco atual.
Basicamente criar um bloco inicial, chamado de gênesis, e a partir dele criar os demais blocos. Sempre usando a chave criada anteriormente para criar a chave do bloco atual.
Primeiros resultados
Para testar o projeto, segue o comando.
dotnet test
Primeiros testes
➜  Test git:(main) ✗ dotnet test
  Determinando os projetos a serem restaurados...
  Todos os projetos estão atualizados para restauração.
  BlockchainPoc -> ./blockchain-poc/Console/bin/Debug/netcoreapp5.0/BlockchainPoc.dll
  BlockchainPoc-Test -> ./blockchain-poc/Test/bin/Debug/net5.0/BlockchainPoc-Test.dll
Execução de teste para ./blockchain-poc/Test/bin/Debug/net5.0/BlockchainPoc-Test.dll (.NETCoreApp,Version=v5.0)
Ferramenta de Linha de Comando de Execução de Teste da Microsoft (R) Versão 16.10.0
Copyright (c) Microsoft Corporation. Todos os direitos reservados.

Iniciando execução de teste, espere...
1 arquivos de teste no total corresponderam ao padrão especificado.
  Com falha AlteraUmItem(3,"Teste alterado") [32 ms]
  Mensagem de erro:
   System.Exception : Sequência inválida no índice #3
  Rastreamento de pilha:
     at Blockchain.Sequence.Validate() in ./blockchain-poc/Console/Blockchain/Sequence.cs:line 19
   at BlockchainPoc.Tests.AlteraUmItem(Int32 idx, String content) in ./blockchain-poc/Test/MainTest.cs:line 35
  Com falha RemoveUmItem(2) [< 1 ms]
  Mensagem de erro:
   System.Exception : Sequência inválida no índice #2
  Rastreamento de pilha:
     at Blockchain.Sequence.Validate() in ./blockchain-poc/Console/Blockchain/Sequence.cs:line 19
   at BlockchainPoc.Tests.RemoveUmItem(Int32 idx) in ./blockchain-poc/Test/MainTest.cs:line 27

Com falha! – Com falha:     2, Aprovado:     1, Ignorado:     0, Total:     3, Duração: 84 ms - ./blockchain-poc/Test/bin/Debug/net5.0/BlockchainPoc-Test.dll (net5.0)
This is a quick report for showing more details of features and their stories.
It requires a bunch of custom fields that were in use by the specific customer,
and a modified name for PIs.
Development Notes
Display Structure
It turns out that adding 150 million Ext containers to a page will kill your
browser, so we are hand-rolling the html to push to the screen for each section.We’re using deft promises to go and get all the data before generating the
html for the PRD section. When we get the stories for each PI, we’re a) just
getting the immediate children and b) adding the array of kids to the PI as
a field called __stories, so we can get them when making the html.
First Load
If you’ve just downloaded this from github and you want to do development,
you’re going to need to have these installed:
node.js
grunt-cli
grunt-init
If you have those three installed, just type this in the root directory here
to get set up to develop:
npm install
Structure
src/javascript: All the JS files saved here will be compiled into the
target html file
src/style: All of the stylesheets saved here will be compiled into the
target html file
test/fast: Fast jasmine tests go here. There should also be a helper
file that is loaded first for creating mocks and doing other shortcuts
(fastHelper.js) Tests should be in a file named -spec.js
test/slow: Slow jasmine tests go here. There should also be a helper
file that is loaded first for creating mocks and doing other shortcuts
(slowHelper.js) Tests should be in a file named -spec.js
templates: This is where templates that are used to create the production
and debug html files live. The advantage of using these templates is that
you can configure the behavior of the html around the JS.
config.json: This file contains the configuration settings necessary to
create the debug and production html files. Server is only used for debug,
name, className and sdk are used for both.
package.json: This file lists the dependencies for grunt
auth.json: This file should NOT be checked in. Create this to run the
slow test specs. It should look like:
{
“username”:”you@company.com“,
“password”:”secret”
}
Usage of the grunt file
####Tasks
grunt debug
Use grunt debug to create the debug html file. You only need to run this when you have added new files to
the src directories.
grunt build
Use grunt build to create the production html file. We still have to copy the html file to a panel to test.
grunt test-fast
Use grunt test-fast to run the Jasmine tests in the fast directory. Typically, the tests in the fast
directory are more pure unit tests and do not need to connect to Rally.
grunt test-slow
Use grunt test-slow to run the Jasmine tests in the slow directory. Typically, the tests in the slow
directory are more like integration tests in that they require connecting to Rally and interacting with
data.
The driver works as middle-man and can be especially handy when events are not supported by kernel module / distro code yet. The driver is listening for events of devices added by default (Asus keyboard and Asus WMI hotkeys) or re-defined devices in custom configuration (e.g. Lid Switch and Asus WMI accel tablet mode). When is appropriate event caught then is handled by custom configuration. For example, can be toggled LED status or changed content of the control file (e.g. fan modes), sent another key event, or executed custom command. Configuration examples are here or predefined layouts here.
If you find the project useful, do not forget to give project a People already did!
Allowed listen to events not only from devices Asus keyboard or Asus WMI hotkeys
Allowed to send custom commands (e.g. xinput enable 19)
Allowed to fix any stateful binary switches (e.g. switch lid state, switch tablet-mode state)
Allowed to fix any special Fn+ key including associated LED (directly via debugfs or kernel modules brightness files) or control files with multiple possible int values (e.g. kernel modules files throttle_thermal_policy – [0,1,2])
Requirements
(Optionally for LEDs without kernel modules yet) have mounted debugfs to /sys/kernel/debug/asus-nb-wmi from kernel modules asus-wmi, asus-nb-wmi
Installation
Get the latest dev version using git
$ git clone https://github.com/asus-linux-drivers/asus-wmi-hotkeys-driver
$ cd asus-wmi-hotkeys-driver
and install
$ bash install.sh
or run separate parts of the install script
run whenever the user logs in (do NOT run as $ sudo, works via systemctl --user)
$ bash install_service.sh
Uninstallation
To uninstall run
$ bash uninstall.sh
or run separate parts of the uninstall script
$ bash uninstall_service.sh
Setup
How to discover the key value and bind it to something else using this driver.
Find the event ID of Asus WMI hotkeys for example like this:
Listen for found event number and press the key you want bind to something else for example using $ sudo evtest /dev/input/event4 (which returns already hex values) or $ sudo evemu-record /dev/input/event4 (where values has to be converted from decimal to hex):
How to discover new LED value? Run file sudo bash tests/test_devid.sh (but FIRST! change range of tested range of ids in script row number 5 for example to 60000..60100, do not worry, value is tried to set up to 1 hex on 1s (pause between testing each device id) and then is reverted back previously exist value so script changes nothing) and during running check by eyes whether is LED activated.
Discovered keys and associated LEDs up to this moment that might be equal across models:
Python scripts to enable Locust to send traffic to a istio ingressgateway which will handle traffic for multiple hostnames.
Rationale
Some challenges I faced while using locust to test traffic on istio service mesh.
In a development test setup these hostname may not get resolved by DNS. So traffic need to resolve IP address manually like in “–connect-to” flag in curl
Many times traffic is sent to a ClusterIP service or a NodePort service (if user does not want a waste a LB from their LB pool.
Deployment of locust in Kubernetes is not an easy method.
These python files will enable locust to handle these challenges. Also Helm is used to address the challenge of deployment in Kubernetes.
Currently main script assumes “istio-ingressgateway” pod runs in istio-system namespace and associated gateways are installed in istio-system namespace.
In the main script edit the sections “#getting service details” and “#getting hostnames” to change to your custom namespace, service and gateway labels.
For testing the script use the example given in “bookinfo-gateway-vs.yaml” & “aegle-wildcard-secret.yaml”.
Check locust master and worker pods are coming up.
If there is a crash check the log outputs of pods and fix the python scripts if needed. Or if it is a infra (kubernetes / istio) related problem, fix it.
If the python scripts are changed to fix step 2, unistall the helm and the configmaps used for installation. Redo the installation.
Once pods are up you can port-forward the locust service and use browser to start test or monitor it as given. kubectl port-forward service/locust 8089:8089 -n locust
Else you can use the locust APIs to start and monitor the test
start the test (host=www.ddd.com does not matter, it takes value from gateway CR)